PV Output Power Forecast
Forecast energy production of rooftop PV (photo-voltaic) installations for the coming hours and days
Table of Content
Forecast Providers and Rough Comparison
Solcast
Solcast is specializing on worldwide PV performance forecasts, based on satellite imaging. They offer forecasts for rooftop installations free-of-charge for up to dual-array configurations.
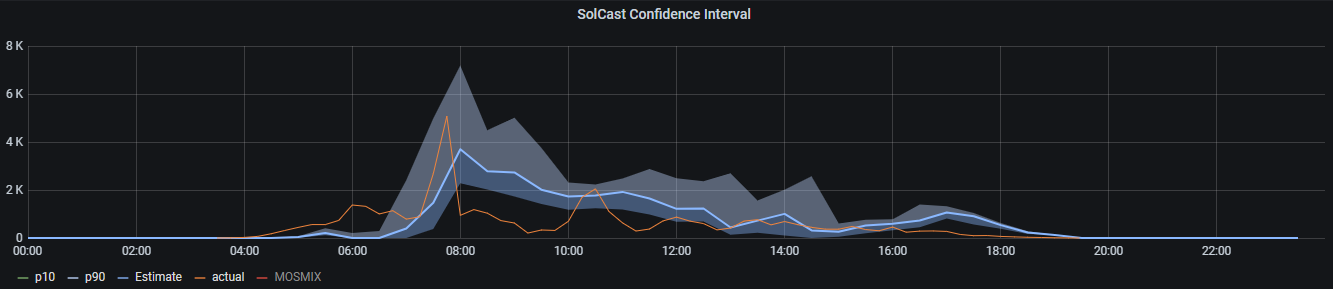
The following shows forecast and actual data for a week in early May 2021:
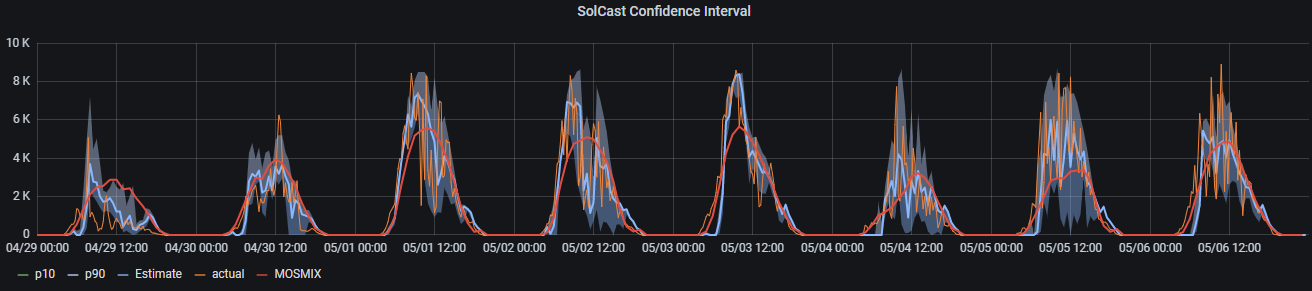
For comparison reasons, also MOSMIX is shown in red. It seems obvious that Solcast does a much better job in modeling the actual ups and downs of output power over the day. This is because they update their forecast every 15min (region dependent) and in the graph the most recent update is shown.
Solcast is also the only source which provides a confidence interval (percentiles p10, p90) for its forecasts. We should hence expect fluctuations of actual generated power roughly within this interval.
Traditional weather services
PV performance forecast can be done with help from traditional weather services such as VisualCrossing, Deutscher Wetterdienst and OpenWeatherMap.org)
They may provide solar radiation data (GHI) or just cloud coverage data. Both can be used to generate a PV power forecast. The following picture shows the result - for a particularly bad day, April 29, 2021:
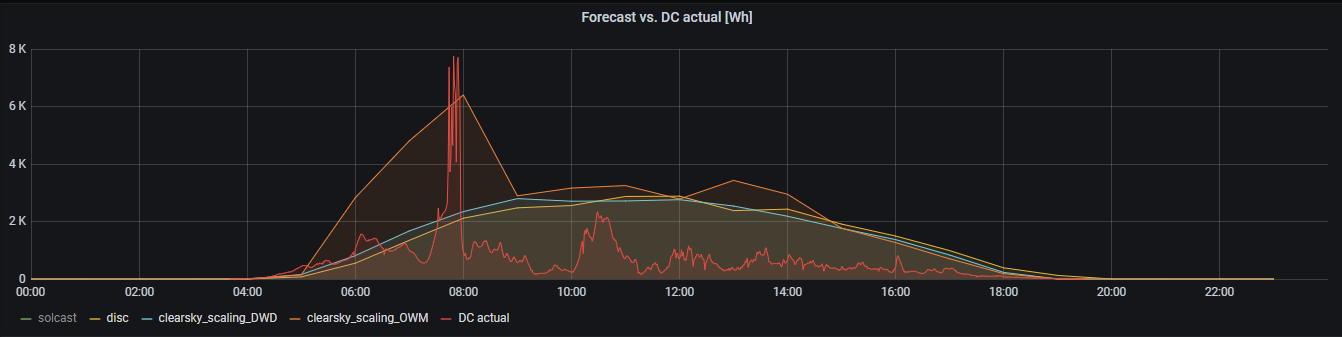
For this to work, we first need have radiation data (GHI) - preferably as provided by VisualCrossing or Deutscher Wetterdienst, DWD (MOSMIX). In case this is not available, we can fall back to cloud coverage data and estimate GHI from that.
Next, GHI (global horizontal irradiation, the solar power (in W) falling on a flat surface of 1m2) is decomposed into DNI (direct normal radiation - the part of energy falling on the same surface due to direct illumination by the sun) and DHI (diffuse horizontal irradiation - the part of energy falling on the same surface due to diffuse illumination, eg. due to reflection in clouds, etc. (This diffuse illumination is of course the reason why it isn’t pitch-black in shadows …).
Various irradiation models can be used to estimate DNI from GHI, but disc is the most common one. DHI then follows the fundamental geometrical equation DNI = (GHI - DHI)/cos(Z) where Z is the solar zenith angle (see eg. Best Practices Handbook).
The most common model to estimate GHI from cloud coverage is clearsky_scaling which first calculates expected output power under clear sky conditions and then modulates this with cloud coverage. These forecasts are generally much less accurate than if a weather service directly delivers GHI: The weather service has considerably more insight into the nature of high/mid/low altitude cloud coverage than a simple scaling algorithm can provide.
This modelling is empowered by the extensive pvlib library.
![]()
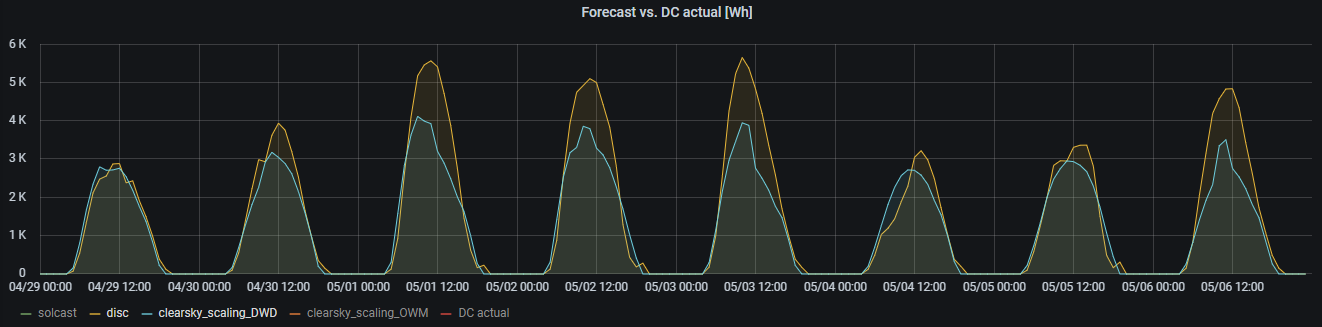
In the following picture, we use GHI (Rad1h in their lingo) from DWD/MOSMIX and calculate PV output power with disc. As GHI data is not available for all stations, clearsky_scaling uses cloud coverage data from DWD/MOSMIX. Both are reasonably closely related to each other:
As with any weather forecast, different providers sometimes diverge. OpenWeatherMap only provides cloud coverage, so - for fairness - we should only compare this with cloud-based forecasts from DWD:
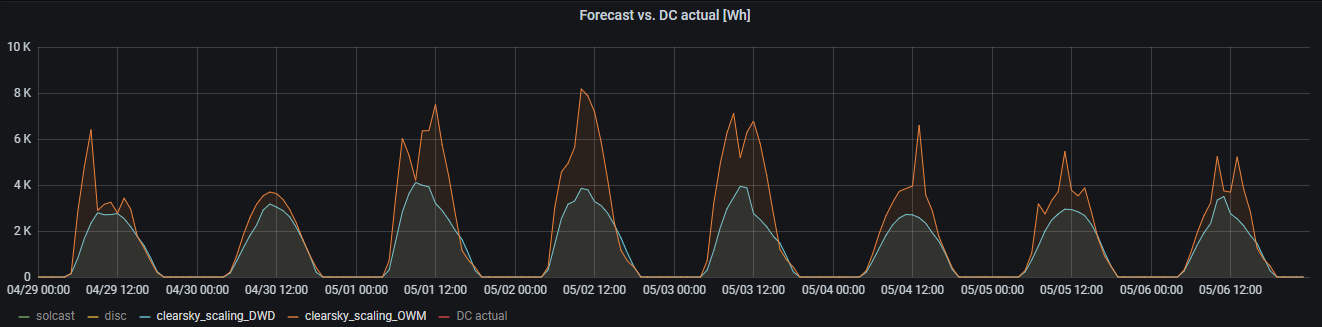
Hmm… what to believe? Forecasts are difficult, especially those about the future!
Forecast horizon
For the example of Solcast, we’ll investigate a bit how forecasts evolve over different forecast horizons. Solcast is updating its forecast every 15min (although forecast intervals are always fixed at 30min for the rooftop version). The maximum forecast horizon is 14 days.
Hence, if we look at eg. April 29th, we get the following picture. The concept described here is identical for other forecast providers, although forecast updates are much rarer (hourly, six-hourly)
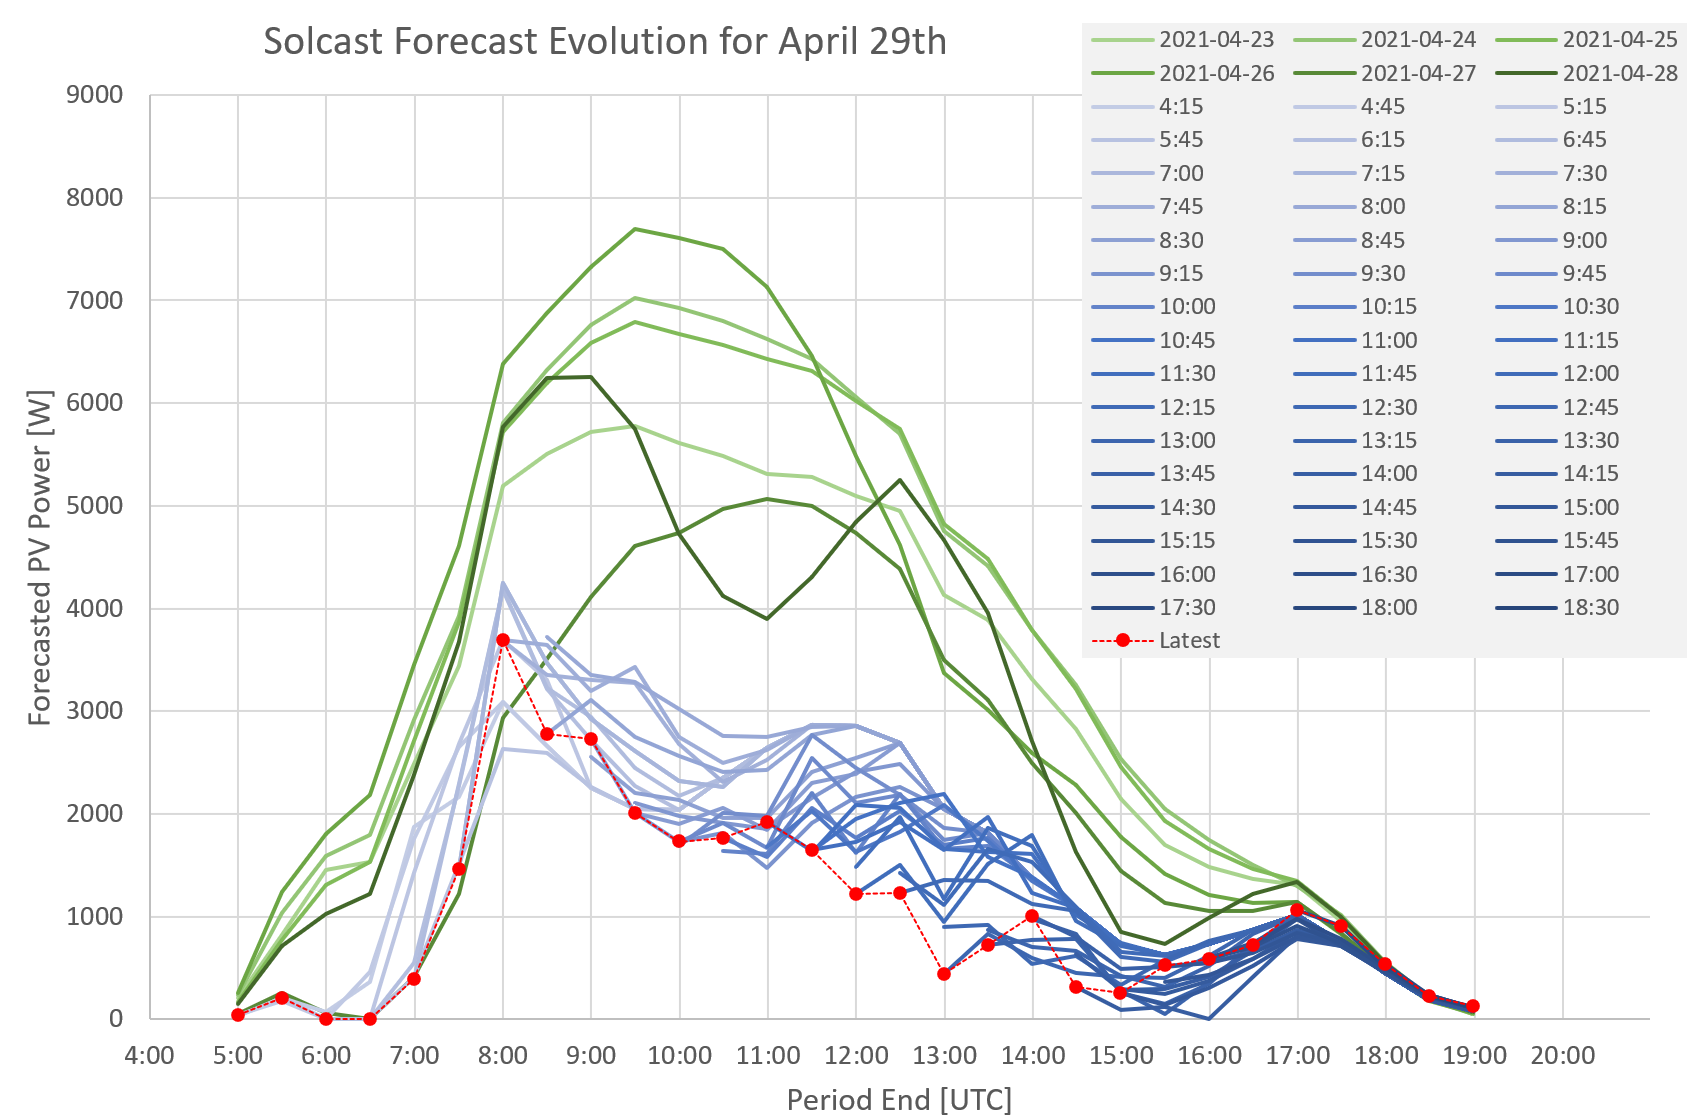
Forecasts from the preceding days (April 23rd .. April 28th) were updated about once a day (greenish) and as accurate as other weather forecasts. However, on the current day (April 29th), forecasts are updated every 15min (blueish).
The red line indicates the latest (last) forecast for the respective 30min time period.
Hence, for this particular day, long term forecasts from previous days were far too optimistic. Satellite based current day forecasts were quite stable in the morning, but trended to lower PV output in the afternoon.
Comparing these forecasts with actuals, show that on this exceptional day, Solcast was still overly optimistic between 8:00 and 12:00 and actuals were even outside the confidence interval of earlier forecasts.
Generally speaking, Solcast and VisualCrossing update their forecasts aggressively over time. MOSMIX does not significantly change forecasts once issued. This is true for both versions of MOSMIX: the station specific three-hourly update (MOSMIX_L) as well as the ‘all-stations’ hourly update (MOSMIX_S).
Quantifying forecast quality
The above discussion motivates a deeper look at forecast quality as a function of forecast horizon: Which forecast is most accurate for current day / next day / future days? Such data will eventually be published here, but it requires recording over an extended period in time.